
Designing your HRMS dashboard: five HR metrics to include
HR metrics are integral to your success, and your HRMS dashboard is the most effective way to present them with clear, real-time visibility. A well-structured HR metrics dashboard gives stakeholders access to the data they need in an easily understood format.
Every HR department has targets to meet. Your HR KPI dashboard makes monitoring those targets simpler, while also giving C-level leaders a quick, reliable overview. Designed correctly, an HR dashboard metrics view becomes a practical decision-making tool; designed poorly, it won't provide much of an overview on anything.
We've discussed in previous articles some of the metrics to measure, but which data should be prioritised when designing your HRMS dashboard?
1. Employee turnover
The cost of replacing an employee is often estimated at 100–300% of their salary, with up to a year before a new hire reaches full productivity. Turnover is highly visible at the leadership level due to its financial impact. Including this in your HRMS dashboard helps managers identify patterns across teams, locations, or time periods.
2. Flight risk of key employees and high potentials
It is almost always more cost-effective to retain employees than to recruit and train new ones. Your dashboard should highlight employees who are high performers but may be at risk—whether due to pay gaps, lack of progression, or low engagement.
Look to combine performance, compensation, and tenure data to flag these risks early and help leadership act before attrition occurs.
Check out our free HR data guide to learn how an HRMS helps you get more out of your HR data
3. Employee skills match expected business needs
A common organizational struggle is a mismatch between a company’s strategic goals and workforce capability. For example, if plans require more engineers but your current workforce is nearing retirement, a skills gap is inevitable.
Your HRMS dashboard can track workforce composition, hiring trends, and succession pipelines, helping you spot mismatches early and adjust hiring or training strategies accordingly.
4. Diversity and inclusion
It has been proven that high-performing teams reflect a range of backgrounds, experiences, and perspectives. While compliance reporting (like EEO-1) offers a baseline, your HR dashboard metrics should go further by tracking progress against internal diversity goals across departments, seniority levels, and hiring pipelines. This makes it the perfect place to monitor long-term change, not just report on it.
5. Employee survey participation and results
Employee engagement has a measurable impact on business outcomes. Low participation in surveys, for example, can signal disengagement before it becomes visible elsewhere; an employee who doesn't bother to participate in surveys because they believe nothing will change is on the way to becoming disengaged and a liability.
Integrating survey results into your HRMS dashboard allows you to monitor sentiment trends, compare teams, and identify areas needing attention. Short, regular surveys are particularly useful for maintaining an up-to-date view of workforce morale.
Final thoughts
These metrics are the tip of the iceberg. Tracking this data is a good starting point for any organization, but it's important to note that HRMS dashboards are highly customizable, allowing businesses to tailor HR reports on practically any performance metric available.

Free white paper
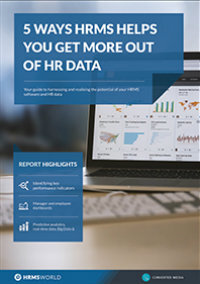
5 ways HRMS helps you get more out of your HR data
A comprehensive guide to the data analytics capabilities of your HRMS
Related articles
-

Managing overtime with your HRMS
Do you maximize your HRMS in the battle to manage overtime?
-

Five HRMS with standout analytics functionality
Some ideal HRMS choices for companies with extensive reporting and analytics needs
-

Four do's and don'ts of people analytics
Optimize your people analytics activities by following these key guidelines